30 July 2025
In July, the Department for Education released annual figures on school exclusions (permanent) and suspensions in English schools. The data reaches back 18 years to 2006/07 providing a rich timeline. Figure 1 below shows the overall rates per 100 pupils.
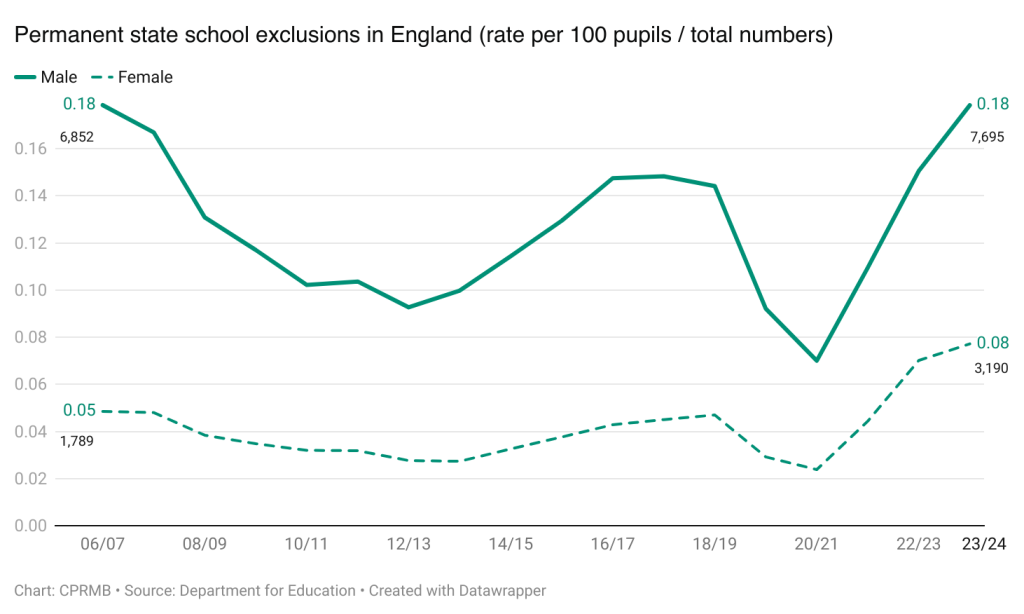
There are many facets that require a deeper dive, however, the main headlines with respect to permanent exclusions are:
(1) The male exclusion rate in 2023/24 (0.179 per 100 male pupils / 17.9 per 10,000 male pupils) is the same as it was in 2006/07. Albeit due to pupil population change, the 2023/24 number (7,696) is higher than 6,852 exclusions in 2006/07.
(2) There have been two troughs in the numbers. The first in 2012/13 where the rate fell to 9.3 per 10,000 male pupils, rising again to 14.8 per 10,000 by 2016/17. It fell again in 2020/21 to 7.0 per 10,000 – however, this period was not the norm as pupils were largely not physically in schools due to the pandemic.
(3) There has been a steep post-pandemic climb since 2018/19 (the pre-pandemic year) from 14.4 per 10,000 male pupils to 17.9 per 10,000 in 2023/24. An increase in 1,686 pupils.
(4) Whilst the male rate is the same as 18 years ago, it is striking to see an increase in female exclusions. The 2006/07 rate was 4.9 per 10,000 female pupils. In 2023/24, it was 7.7 per 10,000 – an increase of 60% (an actual increase in 1,401).
(5) It is, of course, not a competition. Following from (4), in 2006/07, the male exclusion rate was 3.7 times higher than the female rate. Now it is 2.3 times higher. Broadly just over two in every three permanent exclusions were male, when in 2006/07 it was more than three in four.