12 August 2025
It’s A level, T level and Level 3 vocational qualification results day on Thursday. So ahead of then we will be looking at recent trends in results, however, in the meantime, the Department for Education recently published data on higher education entry for England.
In the past the focus has been on using figures for those aged 18. This was because the aged 19 and under cohort figures did not have specific enough data on ethnicity. Now they do, so this cohort is now better suited for research purposes especially as it means there is an opportunity for young men to ‘catch up’ if they are developmentally behind. There is also good data on what type of university they are going to.
The two main tables produced by the DfE show:
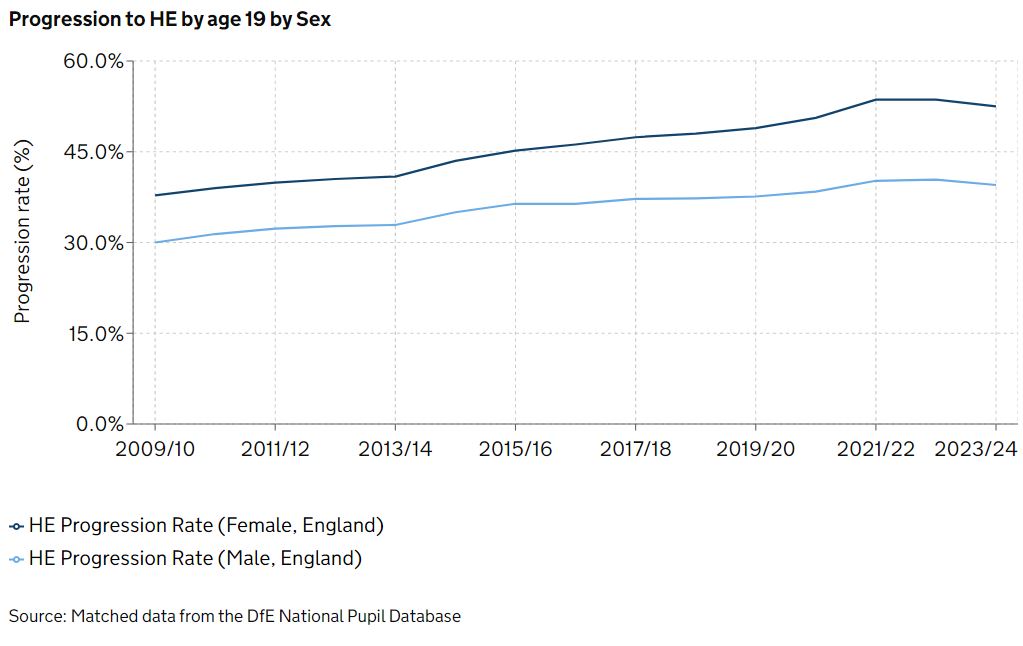
(1) Progression Rates: The progression rates between by age 19 young men and women has both grown and also widened.
In 2009/10 the progression rates were 37.8% for women and 30% for men. In 2023/24, they were 52.5% and 39.5% respectively. The female figure has increased by 38% and the male figure by 32%.
The percentage point gap therefore has increased from 7.8% to 13%. In 2009/10, young women aged 19 and under were 26% more likely to go to higher education than their male peers. It is now 33%.
The figures do not delve into the actual volumes. However, looking at UCAS end of cycle 2024 figures (19 and under, England) – they suggest 35,475 fewer males went into higher education than their peer group (133,770 young men and 169,245 young women). For every 100 young women going into higher education in that age group, 79 young men do. The gap in 2015 was 29,285.
Much of the gap is driven by young men not achieving the same levels of A level entries and A level grades so unless there is a big change on Thursday, this picture is unlikely to change.
Figure 1: Progression to HE by age 19 and sex (England). Graph taken from the DfE website.
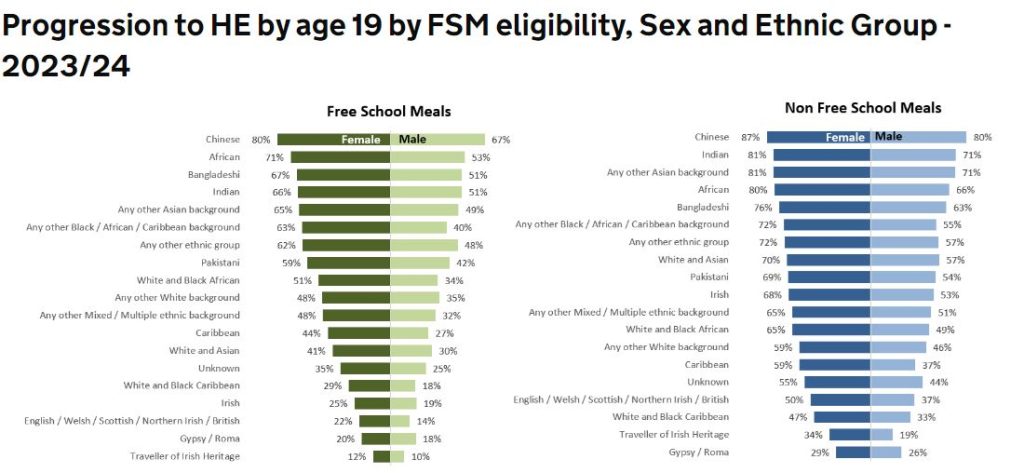
(2) Sex and Ethnicity: The table below shows that the different rates of entry based on ethnicity, sex and free school meals eligibility (often used as the proxy for ‘working class’ or ‘lower-socio-economic status’)
As well as showing that those on free school meals are less likely to pursue higher education than their ethnic peers, it shows that 19 and under young men are behind their family peers in each ethnicity category, irrespective of whether they are both on free school meals.
It means that whatever general education or wider socio-economic policies are created, unless the specific issue of gender and boys’ relative educational underachievement is addressed – they will always be behind their female peers in each category.
The figures on white British working class boys are startling – 14% go onto higher education (22% of their female peers) and that rate is nearly five times lower than Chinese working class boys. Plus it is over 2.5 times lower than their peer group who are not on free school meals.
Figure 2: Progression to HE by age 19 by FSM eligibility, sex group and ethnic group (2023/24). Graph taken from the DfE website.