_1.webp)


It’s A level, T level and Level 3 vocational qualification results day today.
The key points below focus on the A level results and the 18-year-old England cohort rather than those taking the exams at all ages. This provides a more useful and consistent base line as generally they will all be school and college leavers. The figures are published by Ofqual.
There is a short analysis of T level results too.
The figures show:
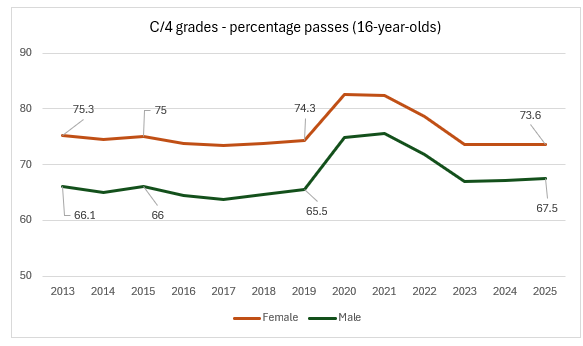
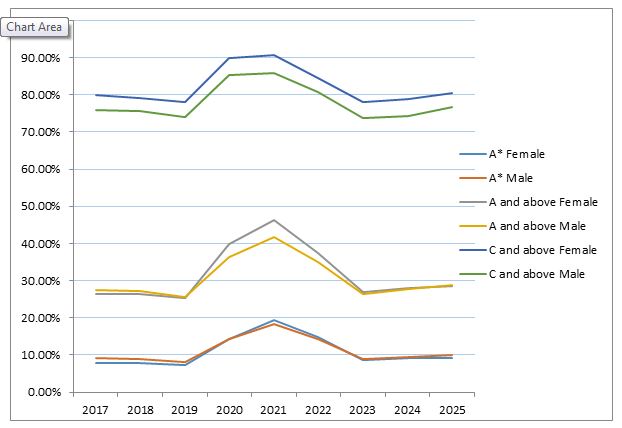
(1) Whilst the pass rate for A* males (9.9%) is ahead of females (9.1%) and at A and above (28.7% and 28.5% respectively), males are behind girls at C and above (76.7% and 80.4% respectively). The latter is more of a reflection of the gender differences overall, given C is seen as an ‘average’ pass.
9.5% of all passes were A*…but this grade hugely dominates the media narrative and headlines.
(2) This pattern has broadly gone back to the pre-pandemic year of 2019.
It remains of interest, due to no research or exploration, that in the A* and A and above categories for 2020-2022, 18-year-old females overtook their male peers.
This was when the exams were teacher-assessed (2020 and 2021) and subject to a transitional grading in 2022. There has been no explanation for this change and research may reveal important information about gender differences in learning and/or marking assessments.
(3) There has been a welcome yet gradual increase in the percentage of A level passes for both males and females from A* to C grades. There was significant grade inflation between 2020-2022 so it is preferable to review progress from an earlier point (2017).
The figures show though at A and above, female pass rates since 2017 have increased by 2.1 percentage points (pp) whilst males increased by 1.3pp. There is now only a 0.2pp gap between males and females, when in 2017, the gap was 1pp.
At C and above, the increase is gradual, with the male pass rate only increasing by 0.8pp since 2017 and females, 0.6pp.
(4) The higher number of subjects taken by the A* high-performing cohort, the better male students perform against their female peers.
Ofqual produced a commentary that showed:
- Of the 18-year-old students who took exactly three A levels, 2.1% achieved all A* grades. Of those, 47.6% were male and 52.4% were female.
- Of the 18-year-old students who took exactly four A levels, 12.8% achieved all A* grades. Of those, 66.2% were male and 33.8% were female.
- Of the 18-year-old students who took five or more A levels, 17.1% achieved all A* grades. Of those, 66.7% were male and 33.3% were female.
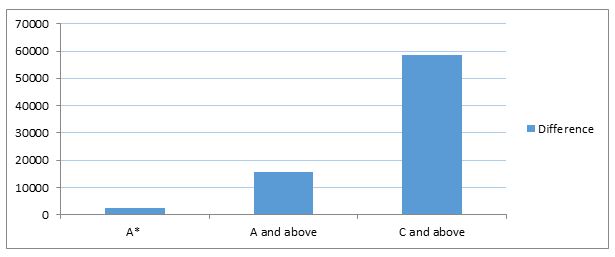
(5) The numbers achieving A levels are very often overlooked as the focus is on theheadline grade percentages.
So while, 18-year-old males in England are receiving a higher pass rate than females at A* and A and above, less males actually take A levels.
It means that whilst there was a higher percentage of males who achieved A* and A and above grades, males overall actually received 2,420 fewer A*s than their female peers; and 15,568 fewer at A and above. Males received 58,690 fewer C and above A levels.
(6) The above also feeds through into university entry.
The latest UCAS acceptance numbers (as at June 2025) for September 2025 entry shows 30,660 fewer English domiciled 18-year-old males have applied than females (155,060 females and 124,400 males). Broadly for every 100 18-year-old female applicants, there are 80 males.
(7) In terms of T levels, more males enter (6,413) than females (5,450).
However, females receive better grades. 74.4% of female grades are at merit and above, whilst only 57.6% of males achieve this.
It also means that despite the gender difference in numbers taking the exams (a reversal from A levels), females still receive more merits and distinctions (2,971) than their male peers (2,913).