_1.webp)

Media reporting and commentary on the latest A level results risks driving the need for evidence-led policy solutions away, when they are needed more than ever.
It is also interesting to see that there is only surface level interrogation of what is actually going on and how that plays within the commentariat. The issue coming from the results are:
- Girls outperformed boys, as normal.
- More girls got higher grades than boys, as normal.
- How the media frame boys as having “beaten”/”outperformed” girls at higher grades – when more girls got them?
The media interchanged used boys/girls but the current terminology is female/male because some A level candidates will be adults. This piece uses boys/girls to ensure alignment with the media commentary.
Relative performance headlines (A and above) do not represent the whole story
The media’s headline gender story focussed on the A and above grades. Not all grades or the majority of grades. Nor the number of students achieving them.
If you skimmed the headlines and ignored/missed the words “top” (some like the Telegraph who did not use the word “top”), it would lead into thinking boys overall outperformed girls. Overall they did not, and not even at A and above when you look at the total numbers.
The media line was that for the first time in seven years, boys were outperforming girls in the top grades (see headlines at the end). Yet less boys got top grades than girls.
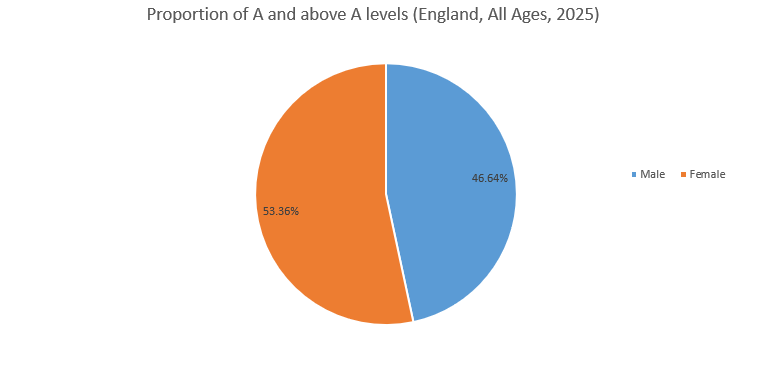
Using all-age data*, it is true that a higher proportion of boys (28.4%) who took A levels than girls (28%) achieved A and above grades.
BUT
Because far fewer A levels are taken by boys than girls (a difference of 60,425), the overall number of actual A and above grades that boys received was lower than girls. It was 15,411 lower.
For all of the A and above grades that were awarded, girls/ received 53% of them.
There is not an equal playing field therefore in terms of assessing overall performance at the higher grades. This would only be achieved if the same numbers of boys and girls took them.
So you cannot truly measure the relative performance between boys and girls at the higher level unless all things are “equal” like entry numbers.
There is a clear variable that needs to be considered in assessing relative performance at the higher level. In addition, if fewer boys study A levels than girls – then the average ability of boys will be higher (remember the ‘performance’ the media and Ofqual use is performance within their own gender only, not the overall numbers of males and females taking them).
So you could expect a higher of percentage of boys getting the top marks because many boys who would potentially get lower grades (D to U, for example) do not enter the exam.
There is a need to support more boys to move into C grades.
B/C and above grades are more representative
Given that A and above grades represent less than one third of all grades, a more representative ‘average’ indicator of overall performance is at B and above (55% of all grades), or even, C and above (77.7% of all grades).
Here, the proportion of boys form within their gender group achieving those grades (B and above – 53.4%, and, C and above – 75.8%) is lower than girls (B and above – 56.3%, and, C and above 79.3%).
So even putting aside entry differentials, girls on average got better grades than boys.
Conclusion
It is important that overall figures and a more representative picture is given, else it risks giving a false impression that boys are no longer underachieving compared to girls. They still are.
It means the public and policy makers who just skim the headlines and do not look at the fuller underlying picture, may assume there is no longer an underperformance problem. When the data shows there is.
Another indicator of the relative underperformance can be seen in higher education entry. 30,000 fewer 18-year-old-boys in England (as at June, according to UCAS) have applied to go university this autumn than their female peers.
That does not look like boys are doing better than girls at A levels.
More widely, it also proves why evidence-based research, narratives and policy is vitally important. Look at the whole picture, not just the area where the colours are the brightest.
How the GCSE / Level 2 exams this week are portrayed will be of great interest.
Notes
*Ages
The CPRMB has preferred to measure A level performance for just 18 year-olds. The This provides a more useful and consistent base line as generally they will all be school and college leavers.
Ofqual use All Ages, and, 18 year-old students in England because it is “the age students are typically when taking A levels”
We have used All Ages for this piece to be consistent with the media usage.
The Research snapshot produced on results day itself used 18-year-olds.
Headlines
Why did boys beat girls at top A-level grades? (The Times)
“Why did boys outperform girls at top A-level grades?” (BBC)
“Boys score more top-level grades than girls” (Independent)
“Boys beat girls for top grades” (Daily Mail)
“Why boys did better than girls at A-levels: Gender gap swings in favour of male candidates for the first time since 2018” (Daily Telegraph)


.png)